
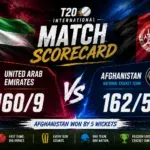
A cricket scorecard can tell you far more than which team won the match. For readers comparing match numbers, cricketscore.it.com offers a useful reference point for checking scores, player figures, innings details, and other important cricket information. The scoreboard gives the final answer, but the scorecard explains how that answer was produced. You can see individual batting contributions, bowling spells, partnerships, extras, wickets, overs, and scoring rates in one place. That makes scorecards useful for casual fans and serious followers alike. They are especially valuable when a match looks simple from the result but was actually decided by several smaller moments. A team can win by six wickets, yet the scorecard may reveal that one batter played almost the entire innings. Another match could end with a large margin, while the bowling figures show that one spell created the real turning point. Scorecards also help when comparing players across matches because the numbers provide a common reference. You do not have to memorize every statistic to understand them. Once the main sections become familiar, reading a detailed cricket scorecard becomes much more natural and surprisingly interesting.
Begin With The Match Summary
The match summary normally provides the quickest way to understand what happened overall. It can show both team totals, the result, innings order, overs completed, and sometimes the player named as Player of the Match. This information should be checked first because it establishes the basic situation before you examine individual performances. In limited-overs cricket, a score such as 184 for 7 after twenty overs immediately tells you the batting side produced a substantial total while losing seven wickets. The same number means something different in an ODI because fifty overs are available. Test cricket needs even more context because teams can bat twice and the result may depend on an innings lead rather than one final total. The match summary can also show whether a team won by runs, wickets, an innings, or another result. A win by runs means the chasing team failed to reach the target. A win by wickets means the chasing side reached the target before losing all its available wickets. These phrases become easier to understand once the innings totals are visible. Start with the broad result, then move into the details.
Study The Batting Table
The batting table is usually the busiest section because it records the contribution of every batter who appeared during the innings. A standard table may include the player’s name, dismissal method, runs, balls faced, fours, sixes, and strike rate. Runs provide the obvious information, but they should never be considered alone. Balls faced show how much time the batter spent at the crease, while boundaries explain part of the scoring method. A batter scoring 75 from 50 balls has played with a different tempo from someone making 75 from 110 deliveries. The first innings may have been important in a T20 match, while the second could be valuable during a Test match where occupying the crease matters. The dismissal column also provides useful information about how the innings ended. A batter who is marked not out has remained unbeaten when the innings ended. This can become especially important when a chase finishes before all wickets are lost. Looking across the complete batting table can also reveal whether the team’s score depended on one major innings or several smaller contributions. That distinction often explains the strength or weakness of a batting performance.
Watch The Balls Faced
Balls faced are one of the easiest scorecard statistics to ignore, even though they add important context to a player’s runs. Suppose one batter scores 50 runs from 35 balls while another reaches 50 from 75 deliveries. Both players have identical scores, but their contributions may have been very different depending on the format and match situation. The first player has scored at a much faster rate, which can be valuable during limited-overs cricket. The second player may have played a useful stabilizing role, particularly when wickets were falling regularly. In Test cricket, spending time at the crease can sometimes be more important than scoring quickly. A batter who faces 150 deliveries can absorb pressure and give teammates time to settle. In a T20 match, however, using too many deliveries without enough scoring can put pressure on the rest of the lineup. Balls faced should therefore be read together with strike rate and match requirements. There is no universal number that defines a good batting performance. Context changes everything. A scorecard gives you the raw numbers, while your understanding of the match helps determine what those numbers actually meant.
Understand Boundary Numbers
Fours and sixes show how many scoring shots crossed the boundary and can provide a quick picture of a batter’s attacking style. A four counts as four runs, while a six counts as six runs when the ball clears the boundary without bouncing inside the field. These numbers can help explain why two batters with similar scores may have looked completely different during their innings. One player may collect mostly singles and doubles, while another reaches the same total through aggressive boundary hitting. In limited-overs cricket, boundaries can be especially important because they allow teams to score several runs without requiring multiple running efforts. However, boundary numbers do not automatically prove that a batter played better. A player making 80 with several boundaries may have benefited from excellent conditions, while another batter could make 60 through difficult running between wickets. The scorecard does not show every quality of a batting innings. It does, however, give enough information to identify broad scoring patterns. When reviewing a batter, look at runs, balls, fours, sixes, and strike rate together. That combination provides a much clearer picture than any single column.
Check The Strike Rate
Strike rate measures how quickly a batter scored compared with the number of deliveries faced. It is calculated by dividing runs by balls faced and multiplying the result by one hundred. A player scoring 60 runs from 40 balls therefore has a strike rate of 150.00. In T20 cricket, that can represent an important attacking contribution depending on the match conditions. In ODI cricket, the interpretation can be different because innings are longer and batters have more time to build their scores. Test cricket places less emphasis on strike rate because survival and sustained batting can be major objectives. Even within one format, strike rate should not be judged without context. A batter may intentionally slow down because wickets have fallen quickly. Another player may attack aggressively because the team needs quick runs late in an innings. A high strike rate can therefore be excellent, but it does not automatically make the innings more valuable. Likewise, a low strike rate does not automatically indicate failure. The required scoring rate, pitch conditions, opposition bowling, and wickets remaining all influence what a batter should reasonably attempt.
Read The Bowling Section
The bowling table provides a useful summary of how each bowler performed during the innings. Standard figures usually include overs, maidens, runs conceded, wickets, and economy rate. These columns work together to explain the bowler’s overall impact. A bowler taking four wickets for twenty-five runs has produced a very different spell from someone taking four wickets for seventy runs. Both players have the same number of wickets, but the cost of those wickets is not equal. Overs also show how much responsibility the bowler received. In limited-overs cricket, certain bowlers may receive their full allocation while others bowl fewer overs because of match conditions or tactical decisions. Maidens show overs where no runs were conceded, although their importance varies considerably between formats. The runs column records how many runs were charged to the bowler. Some extras, such as byes and leg byes, are treated differently and do not always count against the bowler’s figures. Reading the complete bowling table can therefore reveal which bowlers controlled scoring and which ones struggled under pressure.
Economy Shows Bowling Control
Economy rate tells you the average number of runs conceded per over by a bowler. It provides a simple way to understand how much pressure a bowler placed on the batting side. If a bowler concedes thirty runs from five overs, the economy rate is 6.00. Whether that figure is good depends heavily on the format, pitch, opposition, and stage of the innings. A six-run economy may be excellent during a high-scoring T20 match, while the same number could be interpreted differently in another situation. Death-over bowling can naturally produce higher economy rates because batters are actively searching for boundaries. A bowler might concede several runs while still taking important wickets during those final overs. Conversely, a very economical spell may not have produced enough wickets when the batting side needed to be stopped. Economy rate therefore works best alongside wickets and overs. It tells you about scoring control, but it does not tell the entire story of a bowling performance. When several bowlers have similar wicket numbers, economy can help identify who delivered the more controlled spell. It is one of the quickest statistics for comparing bowling efficiency.
Look At Wicket Timing
The timing of wickets can matter almost as much as the number of wickets taken. A bowler who dismisses the opposition’s top three batters early may have a greater impact than another bowler taking three lower-order wickets later. Unfortunately, a basic scorecard may not always explain every tactical detail behind those dismissals. Still, the batting order and dismissal sequence can provide useful clues. If a team loses two opening batters quickly and then builds a large partnership, the scorecard shows both the early pressure and the recovery. If wickets continue falling every few overs, the batting side may have struggled to establish momentum. Wickets near the end of an innings can also matter when a team is trying to accelerate. A dismissal of a powerful finisher during the final overs may prevent a much larger total. Looking at wicket timing alongside partnerships creates a more complete picture. You can identify when the batting side was under pressure and when it managed to escape. This approach is particularly useful in close matches because a single wicket at the right moment can change the entire scoring pattern.
Partnerships Explain Recovery
Partnerships are extremely useful when a team has experienced a difficult start. A scorecard can show that the opening batters failed, but the partnership section may explain how the team recovered afterward. Suppose a team reaches 30 for 3 and later finishes with 190 for 8. The final total suggests a recovery, but the partnership numbers can reveal exactly which players created that turnaround. A fourth-wicket partnership of 100 runs could have completely changed the pressure on the bowling team. Partnership statistics also provide context for individual scores. A batter scoring 45 may not look impressive compared with a teammate making 90, but those 45 runs could have been crucial during a difficult partnership. In Test cricket, partnerships can become even more important because long periods of batting together can change the condition of the match. A partnership that survives an entire session may reduce pressure significantly. In limited-overs cricket, a rapid partnership can transform the required run rate within a short period. Always check partnerships when trying to understand how an innings developed. They show the connection between individual performances and the team’s total.
Do Not Ignore Extras
Extras are runs that do not belong to an individual batter and can have a major effect on the final total. Common extras include wides, no-balls, byes, and leg byes. The exact scorecard presentation may vary, but the principle remains the same. Wides usually add one or more runs to the batting team’s score without counting as a ball faced by the batter. No-balls can also create additional runs and may provide the batting team with a free hit under certain limited-overs playing conditions. Byes and leg byes are recorded separately because they are not charged directly to the bowler in the same manner as wides and no-balls. A high extras total can indicate poor bowling discipline or difficult conditions for the fielding side. In a close match, even a handful of unnecessary extras can become decisive. Looking at extras also helps explain why the team total can be higher than the combined runs credited to batters. This is particularly useful when checking a low-scoring innings. Extras may occupy only one small line on the scorecard, but their contribution can sometimes change the result.
Follow The Chase Carefully
A chasing team’s scorecard should always be read alongside the target because the same total can represent very different situations. If a team needs 100 runs from ten overs, it requires ten runs per over. If it needs 100 from five overs, the challenge is much greater. The required run rate changes after every scoring event, which means the situation can move quickly. Wickets remaining also matter because a team with eight wickets in hand has more resources than one with only two wickets left. A chase can look comfortable based on the required rate but become difficult after consecutive wickets. Conversely, a team can recover from a difficult position if one batter produces a rapid partnership. The final scorecard may show only the completed innings, but comparing scores at different stages helps explain the chase. If the match page includes fall-of-wicket information, use it to identify moments when the chase became easier or harder. The combination of target, current score, wickets, overs remaining, and required rate provides the clearest picture of a limited-overs chase.
Use Fall Of Wickets
Fall-of-wicket information shows the team score when each wicket fell and can reveal the structure of an innings. This section is especially helpful when a team has experienced several changes in momentum. If wickets fall at 15, 28, 40, and 45 runs, the batting side clearly struggled to build a partnership. If the first wicket falls at 110, the opening pair probably provided a strong foundation. Later wickets can show whether the middle order stabilized the innings or whether the team collapsed after a good start. Fall-of-wicket information is also helpful when analyzing individual contributions. A batter scoring 70 may have come to the crease when the team was already in trouble, making the innings more valuable than the number alone suggests. Another batter might score 70 after the team had already reached 200, meaning their role was completely different. The same number can therefore describe very different performances. Check the fall-of-wicket sequence whenever you want to understand the pressure surrounding a batter. It adds timing to the raw statistics and makes the scorecard much easier to interpret.
Compare Across Different Formats
Cricket statistics should always be considered within the format where they were produced. A score that looks impressive in Test cricket may be ordinary in T20 cricket, while a T20 strike rate can be completely inappropriate for a traditional Test innings. ODI cricket sits somewhere between these extremes because teams have fifty overs and can build innings through different phases. Bowling economy also changes meaning between formats. A bowler conceding eight runs per over in T20 cricket may be expensive, while eight runs per over during a short attacking spell in an ODI can have a different interpretation. The role of the player matters too. An opening batter, middle-order batter, finisher, specialist spinner, and fast bowler may have completely different responsibilities. Comparing them only through one statistic rarely produces a fair assessment. Use scorecards to understand what each player contributed within the conditions of that match and format. When comparing players across several matches, look for consistency rather than one exceptional performance. A longer sample provides a stronger indication of actual performance.
Use Numbers With Context
Numbers are powerful because they provide measurable information, but they cannot explain every part of a cricket match. A scorecard may show that a batter made 40 runs, but it cannot fully describe the difficulty of the pitch or the quality of the bowling faced. Similarly, a bowler’s three wickets do not explain whether those wickets came from the top order or the tail. This is why scorecards work best when combined with basic match context. Check the pitch conditions, innings situation, target, required rate, and opposition quality when possible. Weather can also influence certain matches, particularly in Test cricket and rain-affected limited-overs games. A revised target may change how a chasing innings should be evaluated. Player roles matter as well because someone selected primarily for bowling may have different expectations with the bat. Do not force every performance into a simple good-or-bad category. Cricket contains many situations where a modest-looking statistic represents an important contribution. Scorecards provide evidence, but sensible interpretation gives that evidence meaning.
Build Better Match Understanding
Regularly reading scorecards can improve your understanding of cricket without requiring complicated statistical knowledge. Start by checking the team totals and then move through the batting and bowling sections. After that, look at partnerships, extras, fall of wickets, and required scoring information. With practice, you will begin noticing patterns almost immediately. You may see that a team lost because it struggled during the middle overs, or that a bowling side succeeded because it removed key batters before the final stage. You can also identify players who consistently contribute even when they do not produce the highest individual numbers. Scorecards are useful for reviewing recent matches, comparing teams, checking player form, and understanding how individual moments affect results. They can also provide useful information when preparing cricket content or discussing matches with other fans. The key is not memorizing every statistic. Instead, understand what each number represents and how it connects with the other figures around it. That simple habit makes cricket analysis much more enjoyable and much less confusing.
Final Scorecard Reading Guide
A detailed cricket scorecard is essentially a compact record of how a match developed from beginning to end. Team totals explain the broad result, while batting figures reveal scoring contributions, balls faced, boundaries, dismissals, and strike rates. Bowling figures show overs, runs, wickets, economy, and control. Partnerships, extras, fall of wickets, and required rates then provide additional context.
The smartest way to read these numbers is to avoid judging one statistic in isolation. Runs need balls faced, wickets need runs conceded, strike rate needs match situation, and economy needs format context. Once those relationships become familiar, even complicated scorecards become much easier to understand.
For readers who want to follow match results, player performances, innings statistics, and detailed cricket scorecard information, keep checking cricketscore.it.com for useful updates and reliable match references. Review the numbers carefully, compare performances with proper context, and use the latest scorecard information whenever you want a clearer picture of the game.
Read also :-
pakistan national cricket team vs south africa national cricket team timeline
new zealand national cricket team vs afghanistan national cricket team stats
